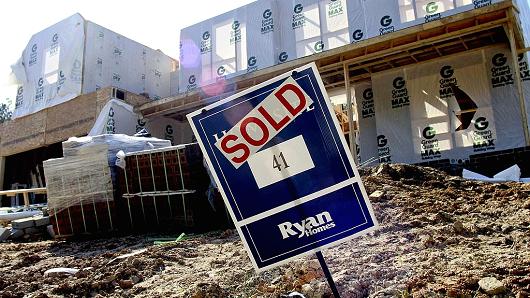
Rising buyer demand and increasingly short supply are lighting a fire under the U.S. housing market. Home prices in August surged on a monthly basis by the largest margin in 11 years, and the annual price gain of 6.2 percent is a sharp acceleration compared to the past two years, according to CoreLogic.
“Housing values continue to rise briskly on stronger fundamental and investor-fueled demand, as well as lack of adequate supply,” said Anand Nallathambi, president and CEO of CoreLogic. “This continued price appreciation is contributing to a growing affordability crisis in many markets around the country.”
States with the biggest gains include Washington (+10.2 percent), Oregon (+10.3 percent), Colorado (+9.1 percent) and Florida (+7.6 percent). Western states are seeing a migration of tech workers from Silicon Valley who have been priced out of the housing markets there.
House prices in San Francisco are actually starting to moderate, up just 2.9 percent annually, but the city still holds the dubious distinction of being the only U.S. market considered “overvalued” on UBS’ recently released “Global Real Estate Bubble Index.” The majority of U.S. markets may not be in so-called bubble territory, but homeownership is becoming increasingly difficult.
“We have an affordability issue generally. California is the biggest problem. There has been a complete decoupling between home price growth and median income growth,” said Jonathan Woloshin, executive director and co-head of fundamental research at UBS.
Woloshin reasons that strong job growth in Seattle and Denver offset fast-rising home prices there; Seattle, however, is seeing a surge of Chinese buyers who are heading south due to a new real estate tax imposed on foreigner buyers in Vancouver, British Columbia. That could push Seattle up on the bubble list in the near future.
But while affordability for buyers is weakening, rising home values are benefiting homeowners who chose to stay put. They cashed out $22.6 billion in home equity in the second quarter of this year, the largest amount since the middle of 2009, according to Black Knight Financial Services. That may sound like a lot, but it is still nearly 80 percent less than the peak of cash-out refinances in the third quarter of 2005, the height of the housing boom. It is not even close to what borrowers could have taken out.
“Given that we saw over $550 billion in tapable equity growth last year alone, this equates to borrowers only tapping into 15 percent of the growth in equity over the past 12 months, without even touching the $4.5 trillion balance in tappable equity available,” said Ben Graboske, executive vice president of Black Knight Data & Analytics. “All in all, it’s clear that cash-outs are helping to prop up the refinance market — their 42 percent share is up from only 30 percent in early 2015 when interest rates had also dropped.”
Not only are today’s borrowers far more conservative, it is just plain harder to qualify for a cash-out refinance today than it was during the loose lending days of 2005. The average FICO credit score among cash out refinancers today is about 748, well above the average score.
Mortgage rates remain near record lows and show little sign of any major gains. This should keep refinance volume elevated, as homeowners priced out of a move up decide to take cash out to remodel. Fall is a traditionally slower and less competitive time of year for buyers, but that is not the case this fall. Inventory continues to drop and homes for sale are moving faster and faster.
[Source:-CNBC]


