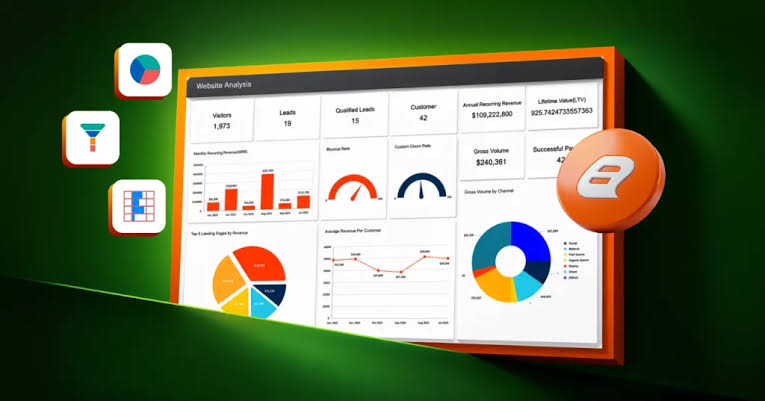
Enterprise reporting has become an essential part of modern business operations. As organisations collect information from sales platforms, customer relationship management systems, financial applications, marketing tools, and operational databases, turning that information into useful reports can be challenging.
Enterprise reporting tools help businesses bring data together, analyse performance, create dashboards, and distribute insights to decision-makers. In 2027, organisations will increasingly look for platforms that combine strong analytics with automation, data integration, collaboration, and accessible self-service reporting.
Table of Contents
Toggle1. Microsoft Power BI
Microsoft Power BI is widely used for business intelligence and enterprise reporting. It allows organisations to connect data from numerous sources, create interactive dashboards, and share reports across teams.
Its integration with Microsoft’s wider business ecosystem can make it particularly useful for companies already using Microsoft 365, Azure, Dynamics, or other Microsoft services.
2. Tableau
Tableau is known for its strong data visualisation capabilities. Businesses can use it to transform complex datasets into interactive charts, dashboards, and reports.
Its visual approach can help users identify trends and patterns without requiring extensive programming knowledge. Tableau can be useful for organisations where data exploration and visual storytelling are important parts of reporting.
3. Looker
Looker, part of Google Cloud, provides a platform for data analytics and business intelligence. It allows organisations to create governed data models and build dashboards and reports around centralised business definitions.
Its connection with the Google Cloud ecosystem makes it a relevant option for companies already operating large-scale cloud data environments.
4. Qlik Sense
Qlik Sense focuses on self-service analytics and interactive data discovery. Users can explore relationships within datasets and create dashboards designed for different business needs.
Its associative approach to analytics can help organisations investigate data from multiple perspectives rather than relying solely on predefined reports.
5. SAP Analytics Cloud
SAP Analytics Cloud combines business intelligence, planning, and analytics capabilities within a cloud platform.
For enterprises using SAP applications, the platform can provide a convenient way to connect operational information with reporting and planning processes. Finance, sales, supply chain, and management teams can use dashboards and analytical reports to monitor performance.
6. Oracle Analytics
Oracle Analytics provides reporting, data visualisation, and analytics capabilities for organisations working with enterprise data.
It can connect information from Oracle applications as well as other data sources. Businesses can use the platform to develop dashboards, analyse trends, and support data-driven decision-making across departments.
7. IBM Cognos Analytics
IBM Cognos Analytics is an established enterprise reporting and business intelligence platform. It supports dashboards, reporting, data visualisation, and analytics.
Its enterprise-focused capabilities make it suitable for organisations that require controlled reporting environments and structured access to business information.
8. Domo
Domo is a cloud-based business intelligence platform designed to bring data, dashboards, and business workflows together.
The platform can help organisations monitor key performance indicators and distribute information across departments. Its cloud architecture can also support businesses that want to reduce dependence on traditional on-premises reporting infrastructure.
9. Sisense
Sisense provides business intelligence and analytics capabilities designed to help organisations embed analytics into applications and workflows.
Its approach can be useful for companies that want employees or customers to access insights directly within business applications rather than working exclusively with separate reporting portals.
10. MicroStrategy
MicroStrategy is an enterprise analytics platform that supports dashboards, reporting, data visualisation, and large-scale business intelligence deployments.
It can be used by organisations that need centralised analytics and reporting across multiple departments. Enterprises can use it to create standardised performance views while still providing analytical capabilities to individual users.
Key Features to Look for in an Enterprise Reporting Tool
Choosing a reporting platform involves more than comparing the number of dashboards or charts available. Businesses should evaluate how well each platform fits their existing technology environment and reporting requirements.
Data Integration
A useful enterprise reporting platform should connect to the organisation’s important data sources. These may include databases, cloud applications, CRM platforms, ERP systems, spreadsheets, and marketing platforms.
Data Visualisation
Clear visualisations can make complex information easier to understand. Look for tools that support dashboards, charts, tables, filters, drill-downs, and interactive reporting.
Self-Service Analytics
Self-service capabilities allow employees to explore approved datasets and create reports without depending entirely on technical teams. This can reduce reporting bottlenecks while giving business users greater access to information.
Security and Governance
Enterprise data often contains sensitive financial, customer, or operational information. Reporting tools should therefore provide appropriate access controls, authentication, permissions, auditing, and governance capabilities.
Automation
Automated reporting can save considerable time. Businesses should consider platforms that support scheduled report generation, alerts, automated data refreshes, and distribution to relevant users.
How to Choose the Right Tool
There is no single reporting platform that is appropriate for every organisation. The right choice depends on company size, existing technology, data architecture, reporting complexity, budget, security requirements, and user skills.
Businesses should begin by documenting their most important reporting requirements. They can then shortlist platforms that integrate with existing systems and conduct practical tests using real business data.
Conclusion
Enterprise reporting tools are becoming increasingly important as businesses generate larger volumes of data and expect faster access to useful insights. Platforms such as Power BI, Tableau, Looker, Qlik Sense, SAP Analytics Cloud, Oracle Analytics, IBM Cognos Analytics, Domo, Sisense, and MicroStrategy offer different approaches to enterprise reporting and analytics.
For 2027 and beyond, businesses should look beyond attractive dashboards and consider integration, governance, security, automation, scalability, and ease of use. Selecting a platform that fits the organisation’s actual data environment can help transform reporting from a manual administrative task into a more efficient part of everyday business decision-making.