Ethereum Vs Ethereum-Classic is producing an endless amount of news and more questions right now. Does ETH need to fork again? What’s going on with this replay attack? Putting aside the technical blockchain considerations as well as the philosophical one’s, today we take a day trader’s perspective to see what the markets are telling us.
The technical setups posted below use simple trend detection, support and resistance, channels, pattern and candle analysis. We aim for high-probability trade setups on ETHBTC and ETCBTC and use very few indicators. Following charts use Poloniex (bulk of ETC liquidity located there) for maximum accuracy. The timeframe for trades is 1 to 7 days. Ethereum is best traded as a purely speculative commodity on 4h+ timeframes.
Market Sentiment and Macro Key Points
This section is an overview of news headlines or events that may affect ETC or ETH.
- Ethereum (ETH) recently hardforked to recover the “stolen” DAO funds. This has caused a split not only in the chain, but also in the community. More information on that here.
- ETC hashrate is growing and the ETH hashrate has dropped since the fork (original chain). Live data can be found here.
- Stampery dropped forked ethereum blockchain (ETH) support due to censorship concerns.
- The ETC chain is gaining developer support, just recently former CEO of the Ethereum project decided to rejoin and make contributions.
ETH Technical Analysis

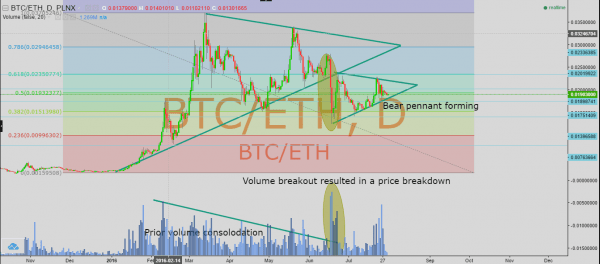
Since the recent DAO attack and Hardfork “bailout”, market sentiment has been bearish. The price action shows bearish signals as well, I believe that ETH has entered a bear market since the DAO attack.
ETH Trade Idea

I have highlighted a zone which we feel offers good risk/reward entry zone. There is a potential bear pennant flag forming. The DAO attack selloff printed a recent low of 0.012. With investor confidence at all time lows after the hard fork “bailout”, we should see the ETH price follow soon. If the ETH where to sell off again, we should see a new low of 0.01 BTC. ETH price is currently at 0.0193.
ETC Technical Analysis

ETC looks to be holding the 23% Fibonacci level very well, the price has seemed to leveled out since the Poloniex launch. Its also worth noting that ETC had a huge 140,000BTC volume day, this is the most volume that Ethereum has ever seen (ETH’s largest volume day was 100,000 BTC).
ETC Trade Idea

With limited price data, ETC has yet to establish solid support and resistance levels. By using the Fibonacci tool and the established high and low range (0.01 – 0.0001) we can estimate where the support and resistance levels may be. With the market sentiment being positive on ETC, and the recent record breaking volume day, I believe that ETC will soon test the previous highs of 0.01. ETC price is currently at 0.0025.
Conclusion
Based on market sentiment and price activity, I believe ETH will see some more downside and ETC will see another rally. Ultimately I believe ETH and ETC will reach price parity at 0.01BTCPlease note any trade in both Ethereum chains is risky at the present time due to recent developments.
[Source:- Brave New Coin]


