The most recent short interest data has been released for the 11/15/2016 settlement date, and we here at Dividend Channel like to sift through this fresh data and order the underlying components of the Dow Jones Industrial Average by “days to cover.” There are a number of ways to look at short data, for example the total number of shares short; but one metric that we find particularly useful is the “days to cover” metric because it considers both the total shares short and the average daily volume of shares typically traded. The number of shares short is then compared to the average daily volume, in order to calculate the total number of trading days it would take to close out all of the open short positions if every share traded represented a short position being closed.
In our new rank based on the most recent short interest data, Visa Inc (NYSE: V) has taken over the position of #5 most shorted Dow component, from International Business Machines Corp. (NYSE: IBM) which is now in the #1 spot.
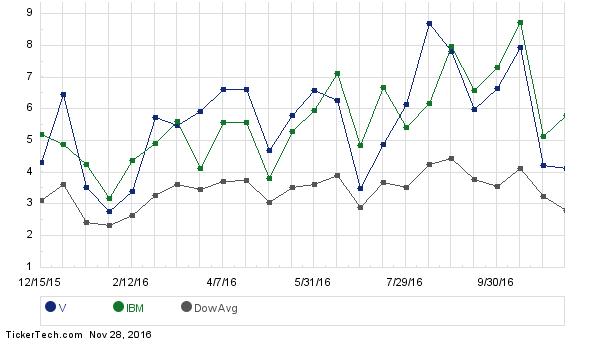
The “days to cover” at 11/15/2016 was 4.13 for V, and 5.81 for IBM; this compares to the average across all Dow components of 2.82. The chart below shows the movement over time of the “days to cover” values of both V and IBM, versus the average Dow component.
Below is a chart showing the relative positions of V versus IBM over time within the 30 Dow components, with #1 representing the component with the highest “days to cover” value (most heavily shorted) and #30 representing the component with the lowest “days to cover” value (least heavily shorted):
A stock with a high “days to cover” value compared to its peers would be considered to have a higher level of short interest as compared to those peers. This could mean short sellers are using the stock to hedge a long bet elsewhere, or could also mean that short sellers believe the price of the stock will decline. When short sellers eventually cover their positions, by definition there must be buying activity because a share that is currently sold short must be purchased to be covered. So investors tend to keep an eye on that “days to cover” metric, because a high value could predict a sharper price increase should the company put out some unexpectedly good news — short sellers might rush to cover positions, and if the “days to cover” number is high, it is more difficult to close those positions without sending the stock higher until the higher price produces enough sellers to generate the necessary volume.
Below is a three month price history chart comparing the stock performance of V vs. IBM:

According to the ETF Finder at ETFChannel.com, V and IBM collectively make up 8.71% of the SPDR Dow Jones Industrial Average ETF (DIA) which is relatively unchanged on the day Monday.
[Source:-Forbes]


